To end 2021 on a high note, DigDash is adding new features and offering you a tool that is increasingly adapted to your needs.
Main new features to remember:
- The end of the desktop studio in favor of a 100% web studio, with a simplified interface designed to help designers in all phases of model and graph creation.
- Numerous features for the dashboard creation assistant, including tools to help with data preparation
- Revised charts: OpenStreetMap maps, in particular, now allow the use of GeoServer and GeoJson data.
- The addition of 3 Spanish regional languages: as the Spanish-speaking market grows, DigDash adapts to its specificities to best meet the demand.
More customised graphics
Tile indicators
New charts have been introduced with the addition of “tile” indicators, represented in two different ways:
- As a horizontal tile, with an icon to the left of the value.
- As a vertical tile, with an icon above the value.
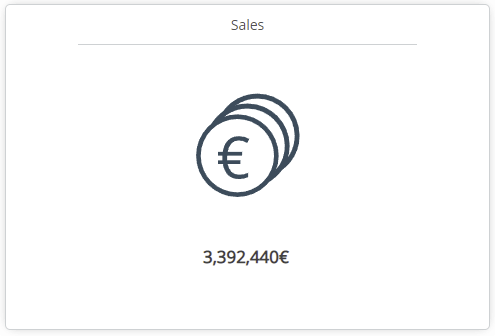
A very visual, clear and precise way to represent a measure and a value, while displaying the associated information. These new graphs can be created easily from the editor, but also from the dashboard creation assistant.
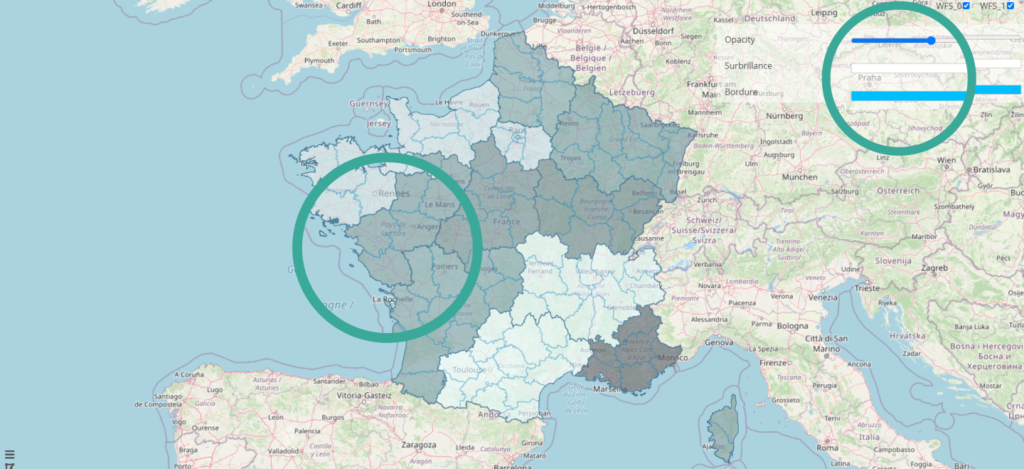
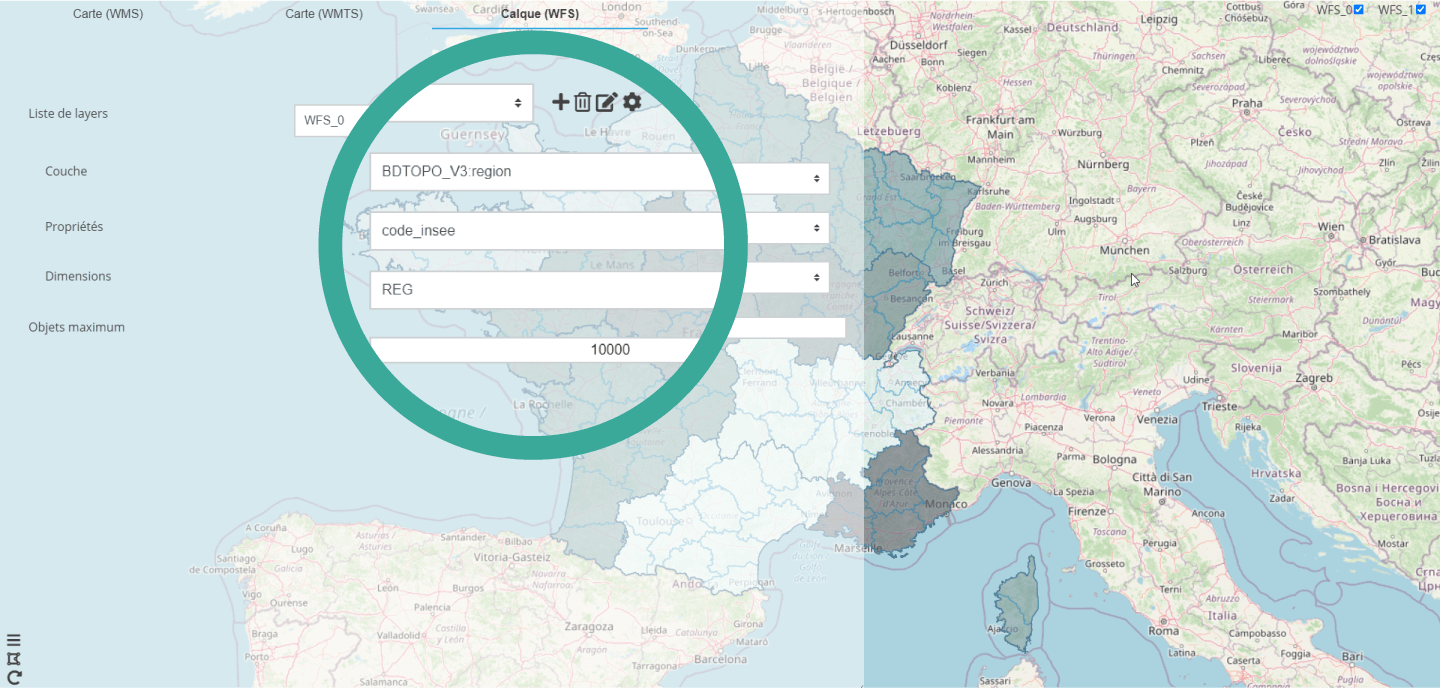
New features for OpenStreetMap maps
There are also many new evolutions in the OpenStreetMap maps. The integration of GeoServer and GeoJson data allows the creation and visualization of personalized maps with very detailed data: regions, rivers, etc.. These new interactive maps allow you to select data with the mouse, adjust the opacity and perform many other actions.
New features in the dashboards
The dashboards created in DigDash Enterprise are evolving to become even more functional.
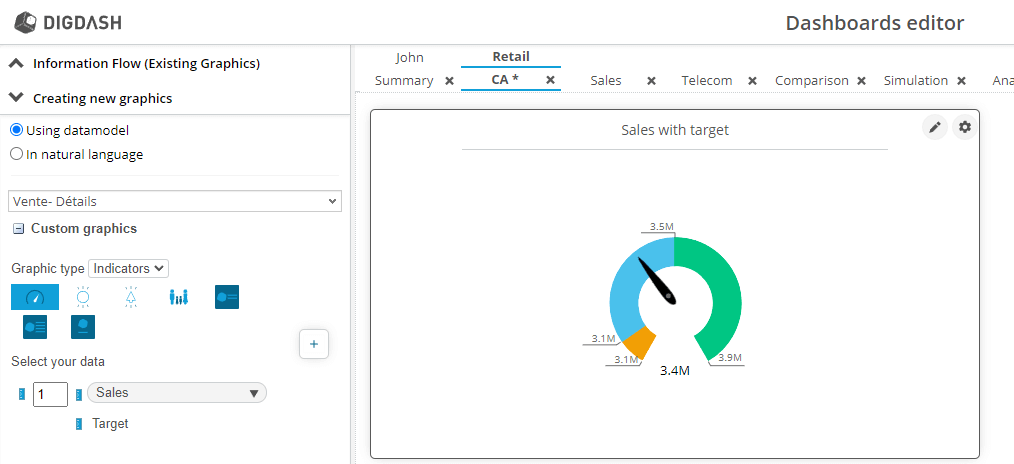
The Self Service BI remains at the heart of our priorities, in order to offer maximum autonomy for the creation of graphical representations. With this new version, users can design completely new types of visuals in just a few clicks, such as performance indicators (gauges, tiles, etc.) and infographics.
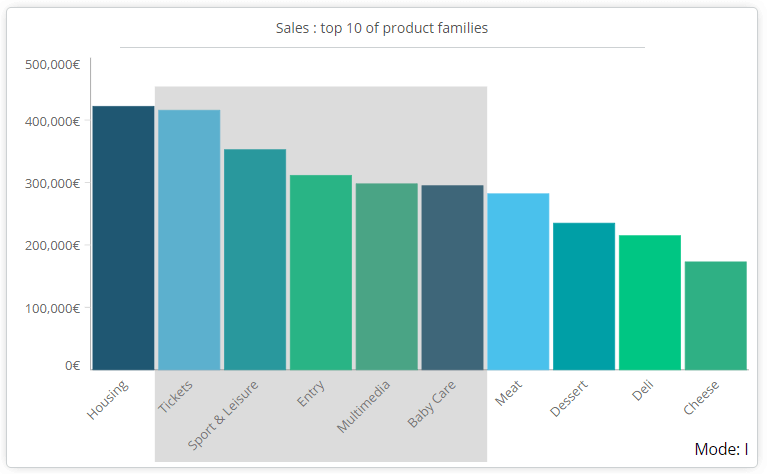
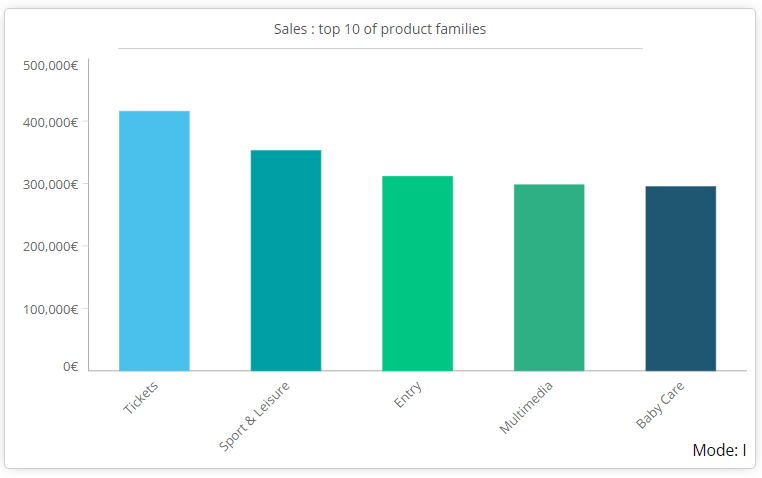
Interaction with the graphs in the dashboards has been greatly simplified. For example, it is sufficient to draw a rectangle with the mouse to select the data contained in a graph.
Adding images to dashboards has also become much more accessible. From the editor, it is now possible to insert a visual directly into the dashboard page by simply dragging and dropping.
An even more powerful dashboard creation assistant
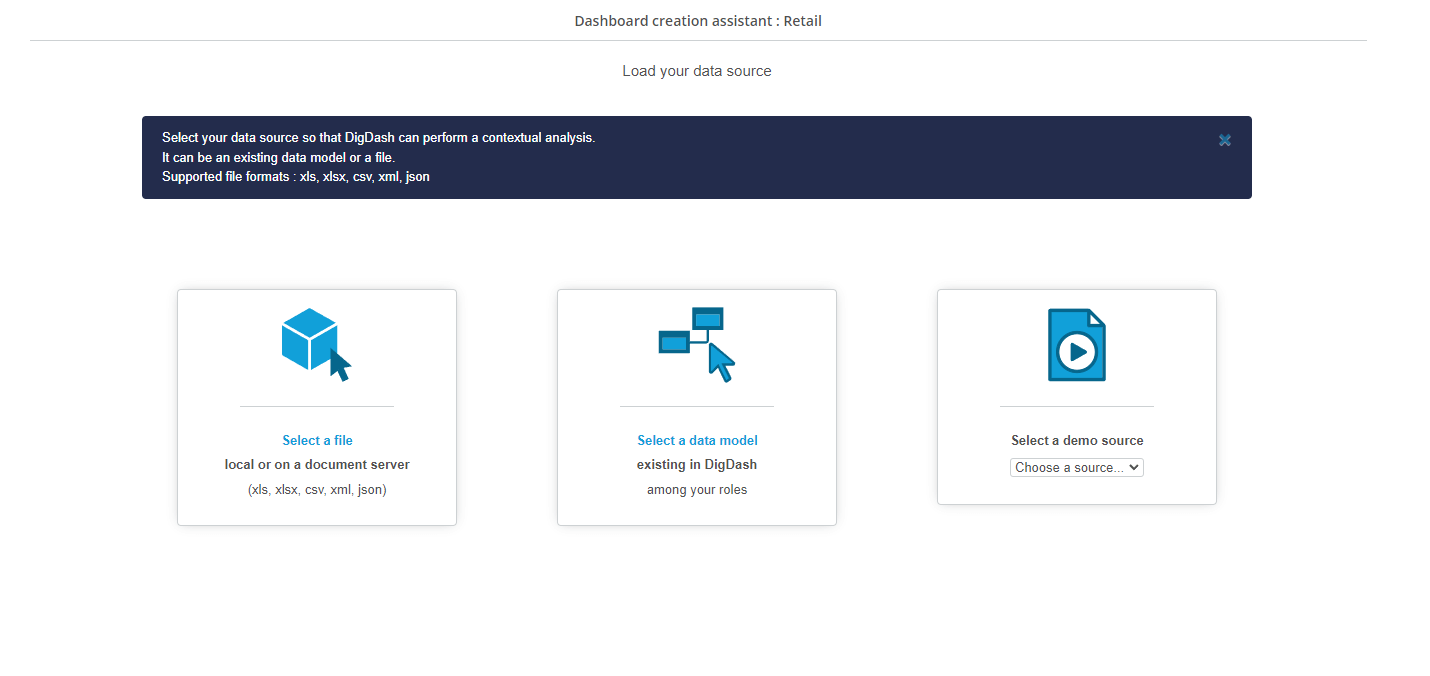
However, the most important changes concern the dashboard creation assistant. Originally, the data source used could be either a local file or a demo source.
Today, it is also possible to use the :
- From a file located on a document server.
- From an existing data model in DigDash.
The dashboard creation assistant is also enriched with a data preparation tool, allowing the use of transformation functions on the columns of a model. This includes for example the concatenation of two columns.
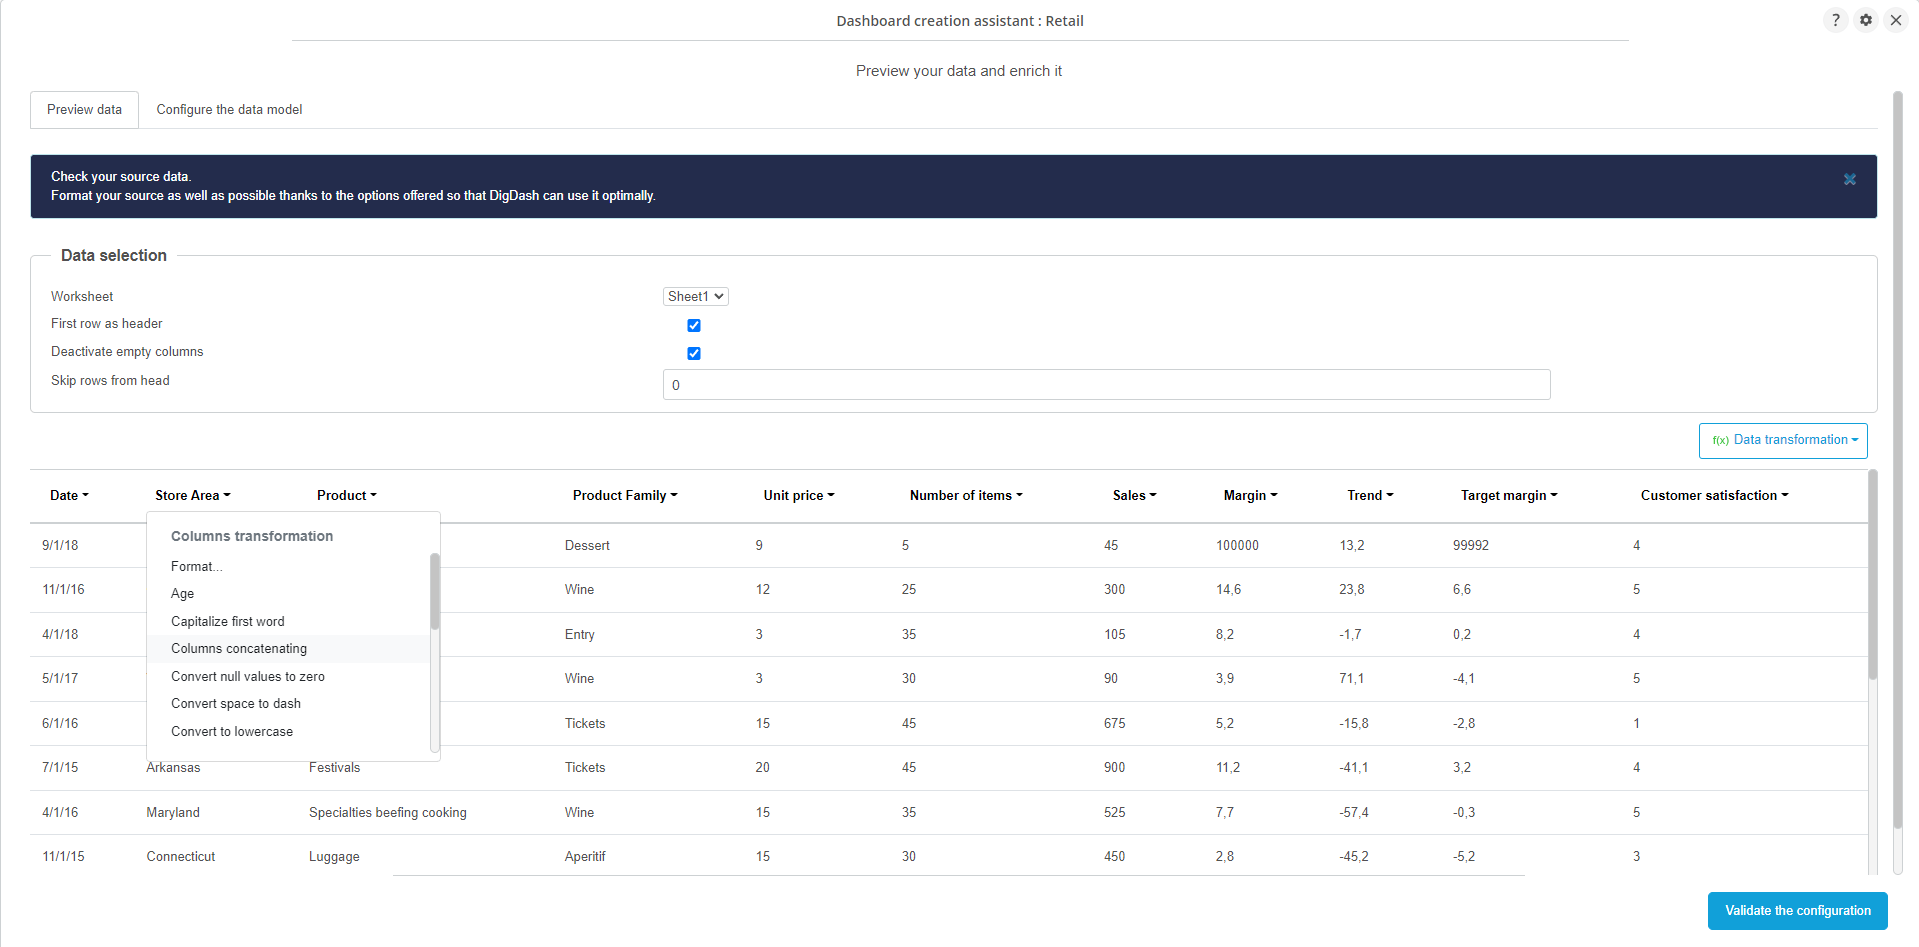
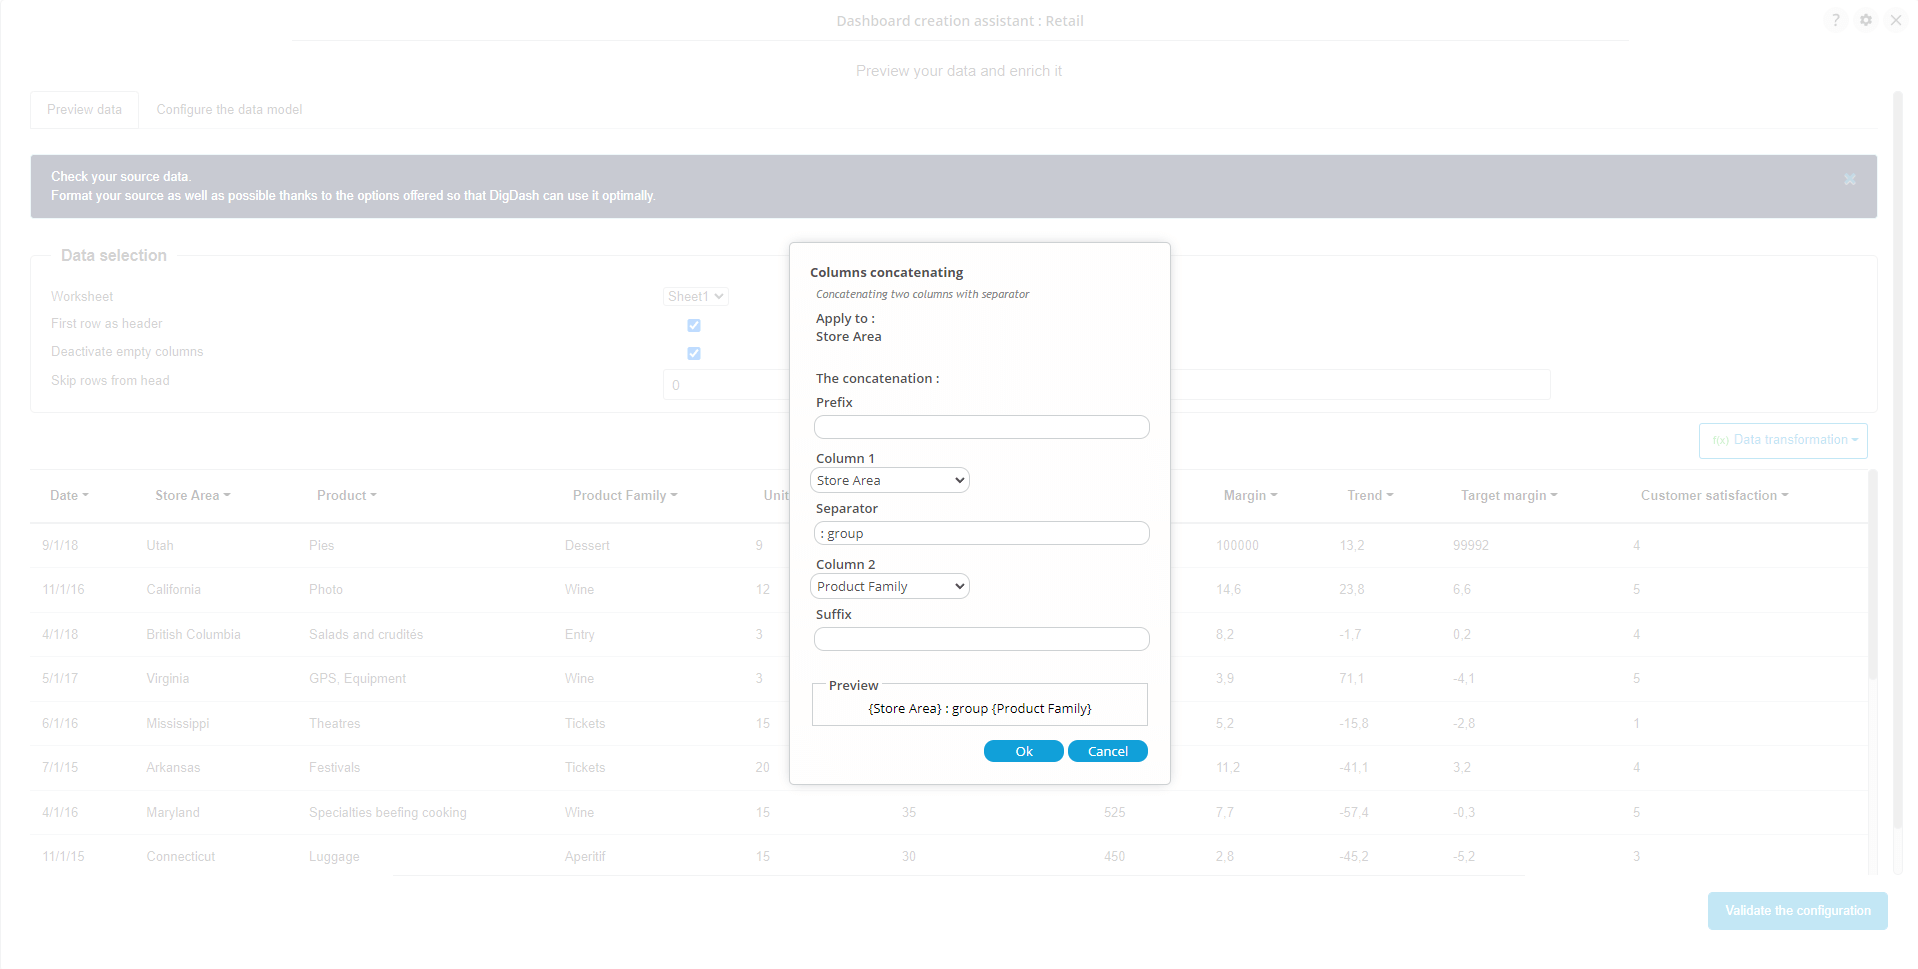
A data preview feature is also introduced.
More user-friendly data models
With this new version of DigDash, data models become more accessible and easier to configure.
A user-friendly data model editor
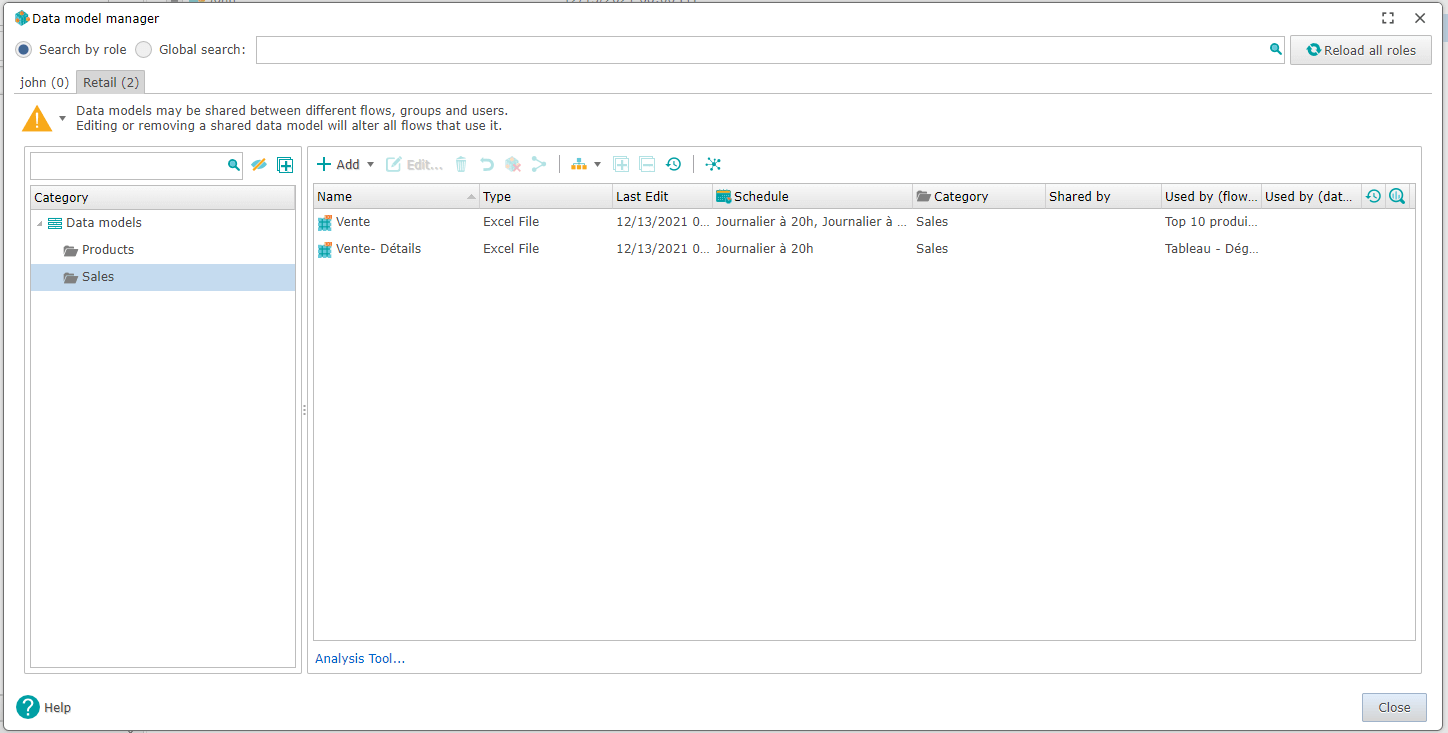
Thanks to an improved interface, the configuration of data sources has been optimized. It is now possible to classify them by category and thus find them very easily.
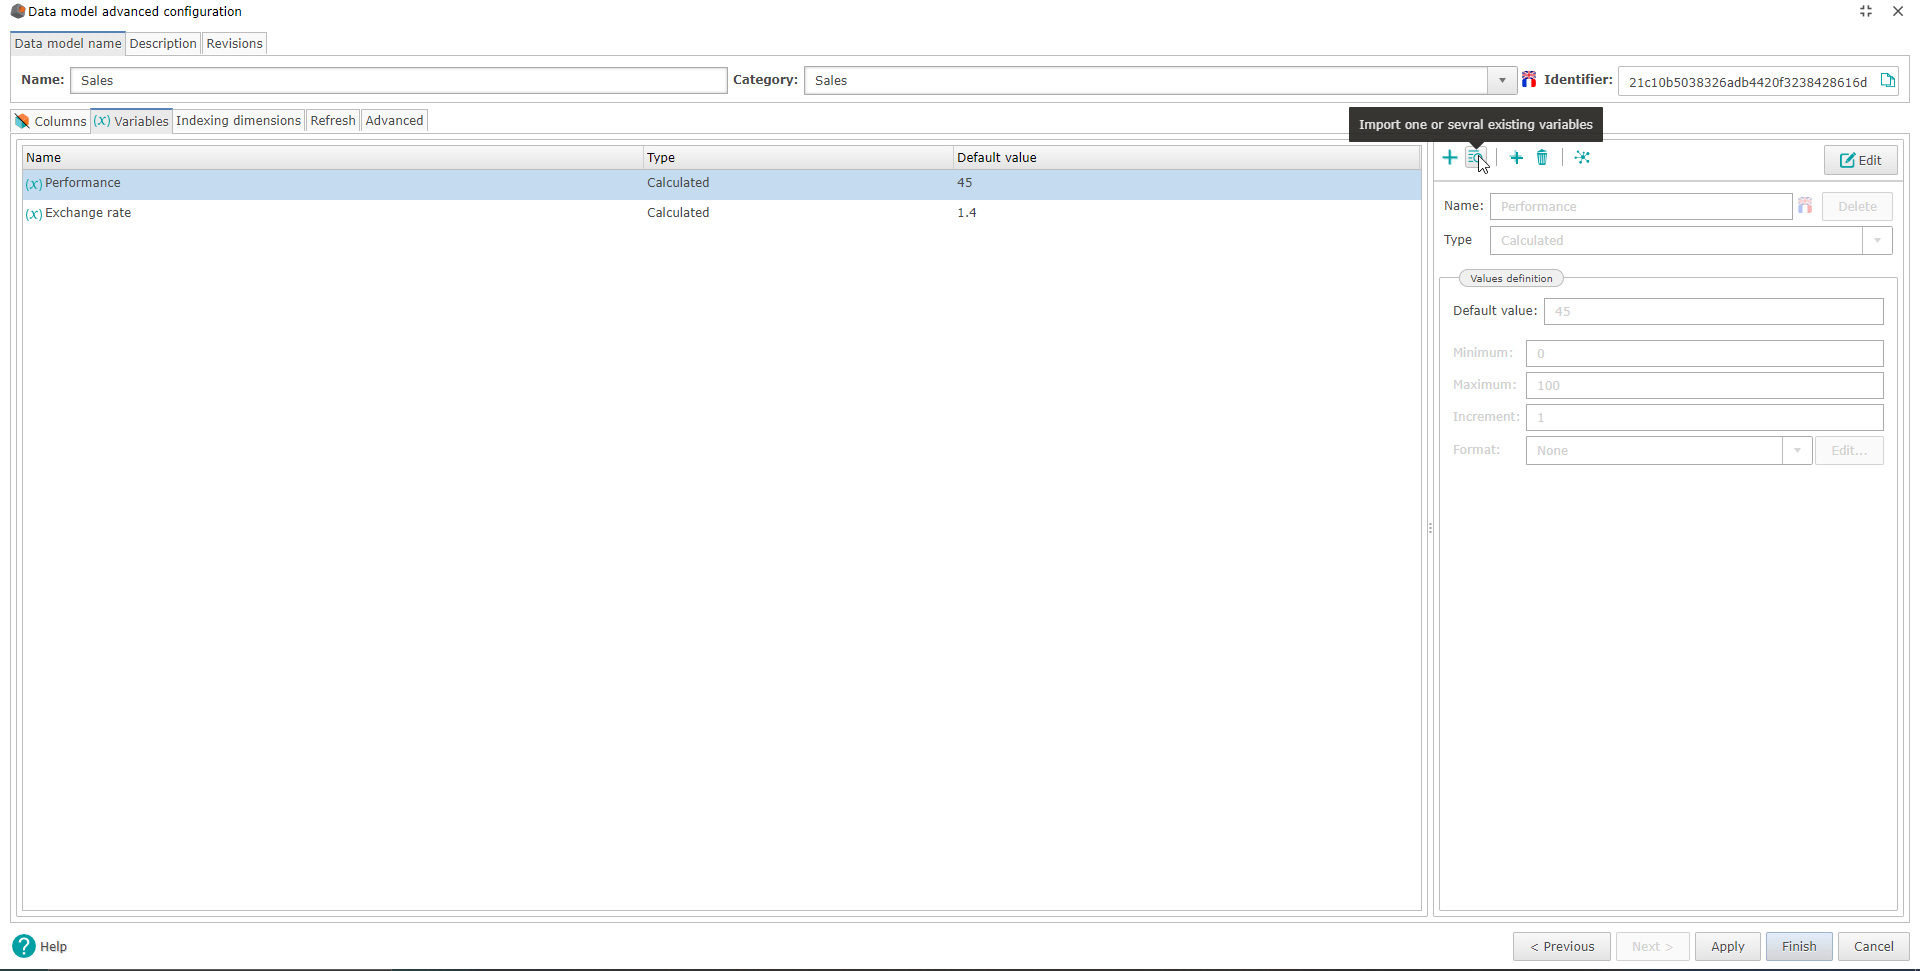
The interface for editing data models has also been revamped and offers improvements in ergonomics: elements are now displayed in tabs for better readability, whether for editing variables or managing data refreshments.

Multilingual editing of dimensions and measurements can be done directly on the right-hand side of the screen, without changing dialog boxes or opening pop-ups.
Modification of measures and creation of metadata
In addition, editing the measurements created with the wizard is now much more intuitive. There is no need to edit the JavaScript code: changes can be made directly from the wizard.
In addition, the creation of metadata (variables, objectives, etc.) in the models has been greatly simplified. For example, it is possible to import or duplicate data from an existing model.
Data preparation tool
Just like the functionality available in the dashboard creation assistant, data preparation now includes transformation functions.
This is a major development, as it allows anyone to transform data easily, without having to write any JavaScript code.
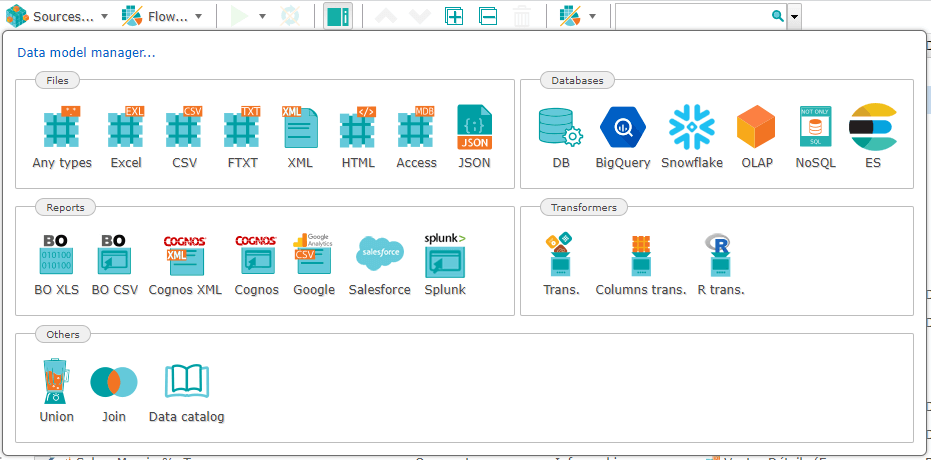
New connectors
This update of DigDash also includes three new connectors: SnowFlake, SAP Hana and Big Query. Improvements have also been made to existing connectors, including SAP BEX and Elasticsearch.
The studio continues to evolve
DigDash’s full web studio continues to be enriched to be even more aesthetic, simple and pleasant to use.
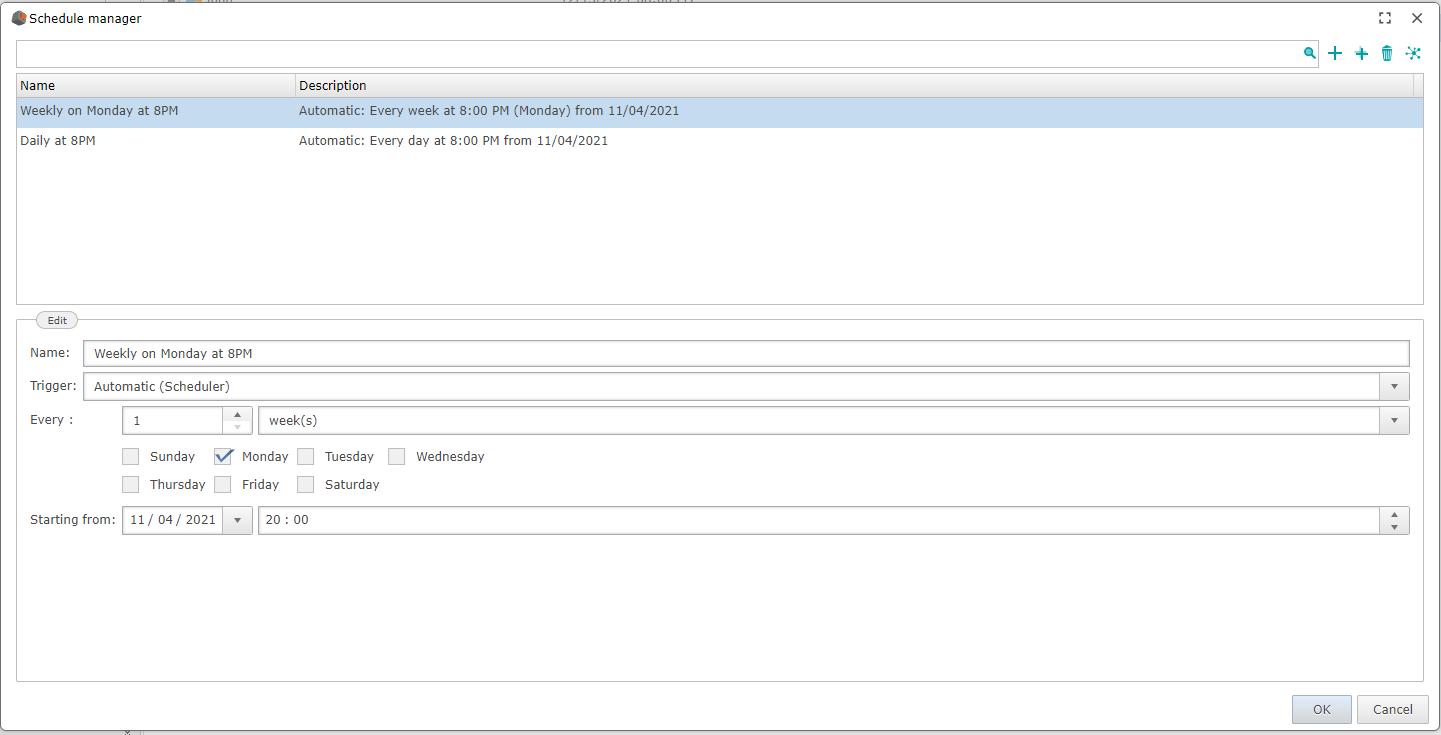
A new interface for managing colour palettes allows, among other things, to classify palettes by category for greater clarity. In addition, the addition of a data update manager allows the creation, editing, and deletion of tasks for refreshing data.
Document builders
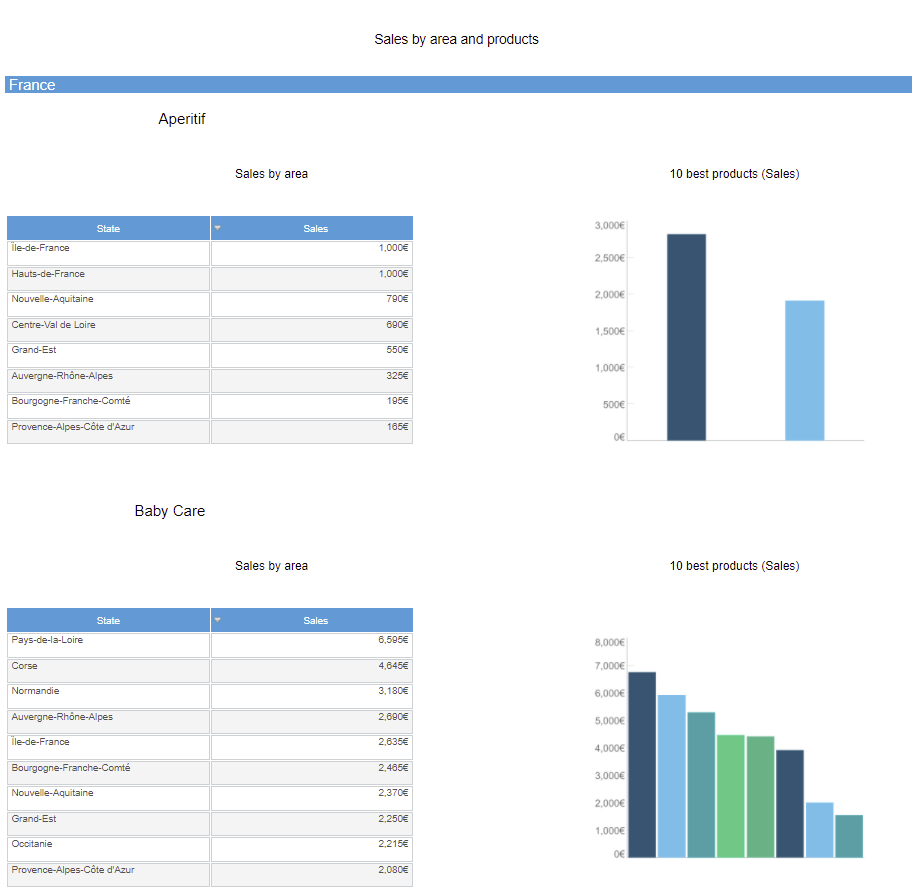
With the integration of HTML builder earlier this year, DigDash Enterprise allowed the creation and sending of newsletters containing automatically generated graphics. Now, a new feature allows the insertion of multiple levels of sections, with the aim of better structuring the final document.
Finally, in PDF document builders, it is possible to use complex styles within a text box.
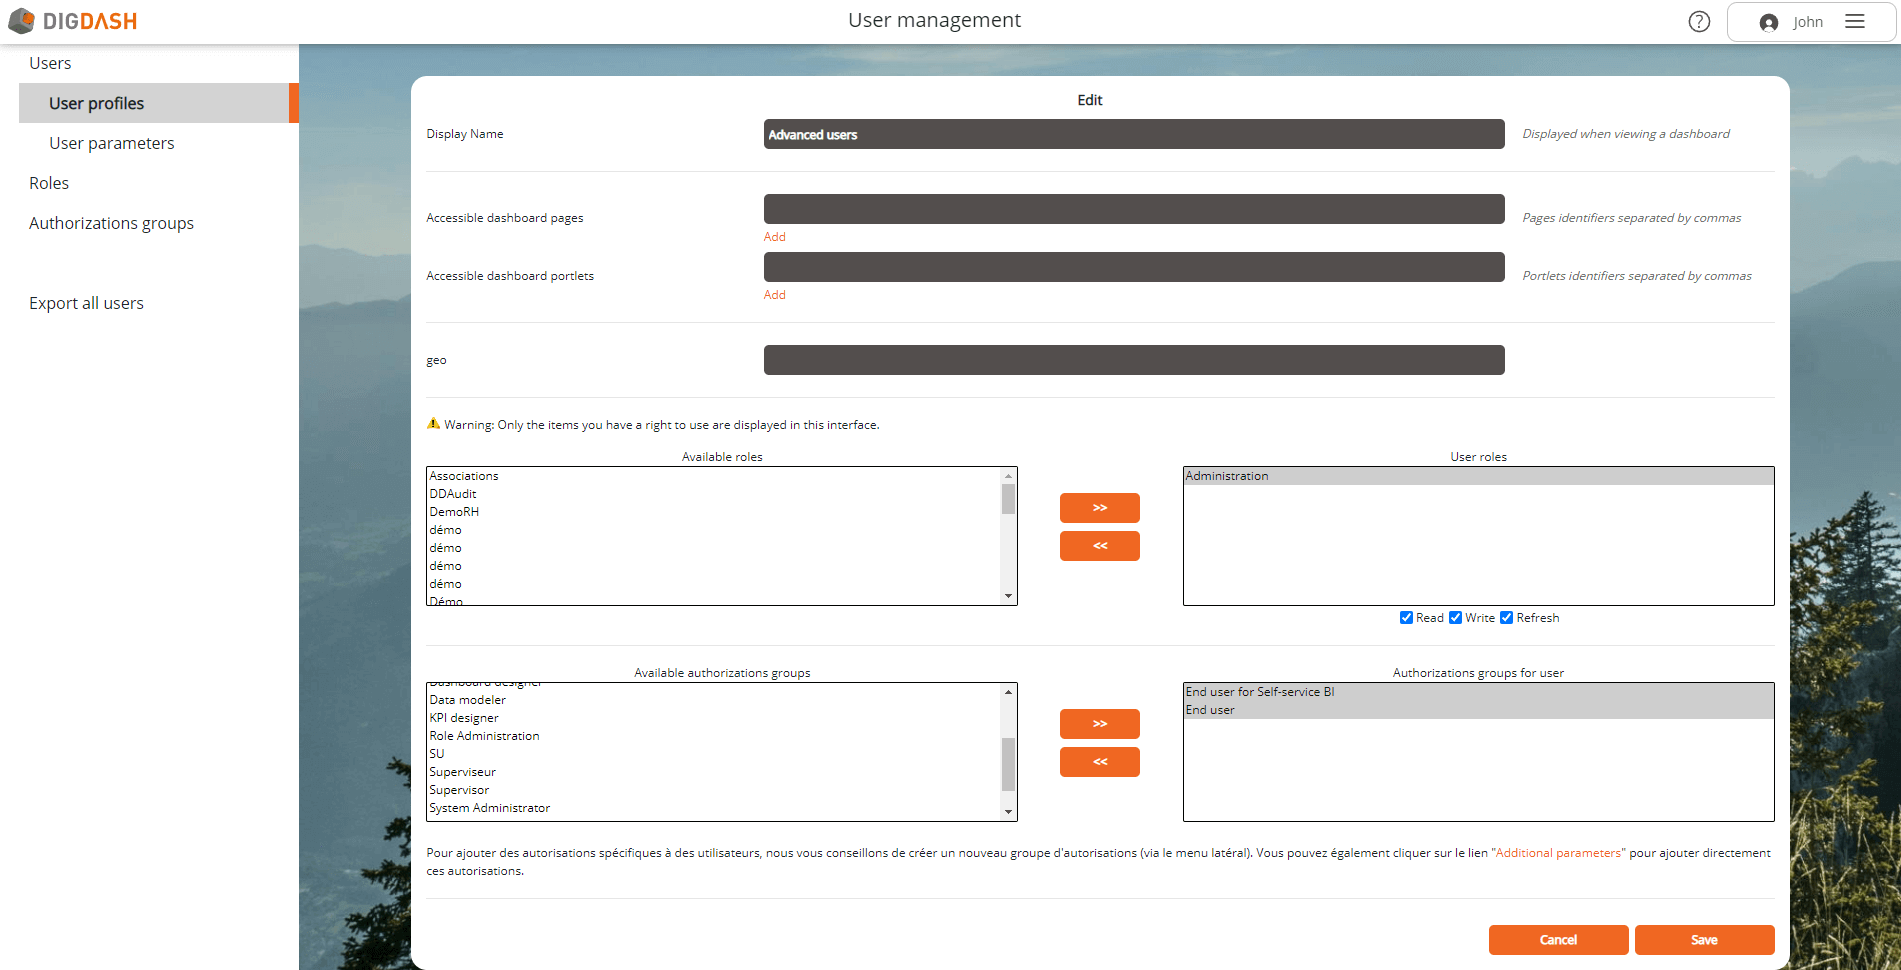
A simplified configuration
In order to facilitate the accreditation of rights and roles, user profiles have been introduced in DigDash. Each profile, which contains a set of rights and roles, can be assigned to a user who will automatically inherit all the settings associated with that profile. Changing user rights is now much more intuitive, as it only takes a few clicks to edit their profile.
With this new version of DigDash Enterprise, you have even more leeway for creating dashboards, preparing data and editing data models. Ever simpler, ever more accessible, the tool accompanies the user at all times, while offering advanced and powerful functionalities to expert profiles.