You are entering the Business Intelligence world and you do not know where to start? DO not panic, our guide will help you assimilate the BI base vocabulary.
Business Intelligence, dashboards, reporting… it has already been a long time since we started discussing these terms. Each Monday, we were struggling to find a simple way to explain some Business Intelligence vocabulary. It is now done via this article.
dimensions, measures, hierarchies… What would you say about a short article explaining the base vocabulary?
Basic vocabulary in Business intelligence
You are more numerous wanting to use dynamic dashboards with the goal to automize your tasks and to gain time.
In order to help you and to help the business user (who is not supposed to be an IT professional), we want to go back to the basic vocabulary that surrounds the Business Intelligence world and therefore help you to start on strong bases.
Definition n°1 (and the most important): What is Business Intelligence?
Business Intelligence (BI) is a set of tools and methods for transforming raw data into relevant information and visualizing it to facilitate decision-making within an organization. From preparation to data sharing, including their exploration, it is a global approach allowing to exploit the full potential of data.
With BI (or business intelligence), the user operates in manual mode and can design specific activity reports.
Thus, the strategic objectives of the company can be analyzed in real time and compared with the actual results obtained. If deviations are noted, it is possible to quickly discover their origins and correct them.
| Go further :
Big Data and Business Intelligence : What are the differences? |
Big Data and Business Intelligence: what are the differences?
Definition n°2: What is a dynamic dashboard?
A dynamic dashboard is a set of graphic representations on which the business users can not only visualize and interact with the relative information at their availability but also communicate with their collaborators in real time.
With a BI platform like DigDash Enterprise, it is possible to create a personalized dashboard in a few clicks thanks to an intuitive interface. Users can even be supported by a dashboard creation wizard, for even more accessibility.
| Find out more: |
12 reasons to choose DigDash to create your agile dashboards
Definition n°3: What is a Data visualization?
Data visualization is the art of using the right graphics or animations to represent data or indicators visually. The goal is to use the correct graph at the correct time, to transmit the appropriate information to the user. You would use column graphs if you group a measure according to a continuous dimension, whereas in the case of a discrete dimension it is more adapted to use a horizontal bar graph.
Definition n°: What is a Key performance indicator (KPI)?
It is difficult to discuss dynamic dashboards without mentioning indicators. Key Performance Indicators are the indicators on which a company’s collaborators will base themselves in order to know which objectives have been attained. We often associate an objective to reach and we can color code to qualify the completeness of the objective (green, yellow, red).
With dataviz, KPIs can be represented using graphics, greatly facilitating their reading and analysis.
Definition n°5: What is a Self-service BI?
Historically, Business Intelligence was the business of a handful of IT specialists, as it required advanced technical skills. But those days are over thanks to self-service BI, a new approach that aims to empower business users.
With this self-service concept, non-technical profiles have a great deal of autonomy in the exploration and analysis of data, thanks to more accessible and intuitive tools.
Definition n°6: What is a data source?
A data source is, as its name suggests, the place where the data used for business intelligence comes from. A source can be a file, a particular database on a DBMS, or even a live stream of data. Finally, it can be the place where the data was created, but also where the physical information was digitized.
With DigDash Enterprise, it is possible to quickly clean up and prepare a data source, whatever its nature.
Read also: Big Data and Business Intelligence: what are the differences?
Big Data and Business Intelligence: what are the differences?
Definition n°7: What is a data cube?
A data cube is a method to store data that contain the definition of measures, dimensions, and hierarchies. This structure is used in BI software and allow to rapidly and simply obtain aggregated data.
Definition n°8: What is an Ad’hoc analysis?
Ad hoc analysis is a data analysis process that has the particularity of being entirely organized and created by the business user, according to their needs. It therefore allows you to create dashboards and activity reports autonomously, without resorting to the IT department.
With ad hoc analysis, the user himself determines the data sources from which he wishes to extract the data. He can also customize the content of his analysis, but also the way in which the data will be presented.
Definition n°9: What are a data mart and a data warehouse?
A data mart is an organized data warehouse that allows responding to the problematics encountered by a company’s business unit. A data warehouse is a set of data marts. for example, if a company has various departments (marketing, finance, HR), we would have three data marts associated with those departments. The grouping of these data marts is called a data warehouse. The following example has for an objective to put in context the entirety of the definitions we have presented.
| Coulumn name | Type | Description |
| Date | Continuous dimension | Date when the data has been recorded |
| Region | Discrete dimension | Geographic region where the data has been recorded |
| Business Unit | Discrete dimension | Company’s business unit (HR, Marketing, etc) |
| Material | Discrete dimension | Phone model |
| Length of communication | Measure | Time in minutes |
| Communication quality | Measure | Grade |
We have four dimensions of different natures (discrete and continuous). The dashboard software DigDash Enterprise allows going further by automatically adding two other types of dimensions
- A time dimension (date)
- Geographic dimensions (region)
It brings us directly to the hierarchy notion. When DigDash Enterprise detects a geographic or a time dimension, it automatically creates the following hierarchies:
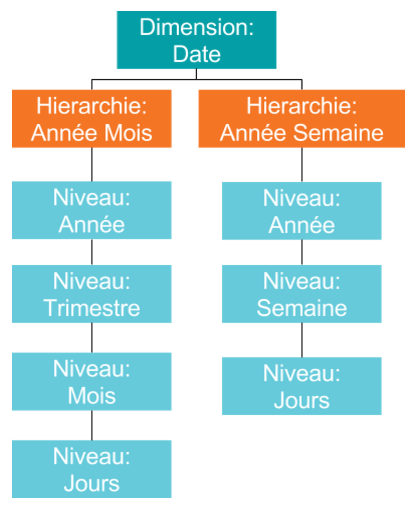
It is also possible to manually create your own hierarchies. For example, in the case of elements, it could consist to of classifying the different phone models in two categories:
- Mobile phones
- Landlines
To better illustrate the previous points as well as the aggregation and the data cube notions, we will go over the data visualization portion. We will build a map on which we wish to visualize the average communication quality according to geographic zones.
If we position ourselves at the highest geographic hierarchy (continent), we obtain the following map:
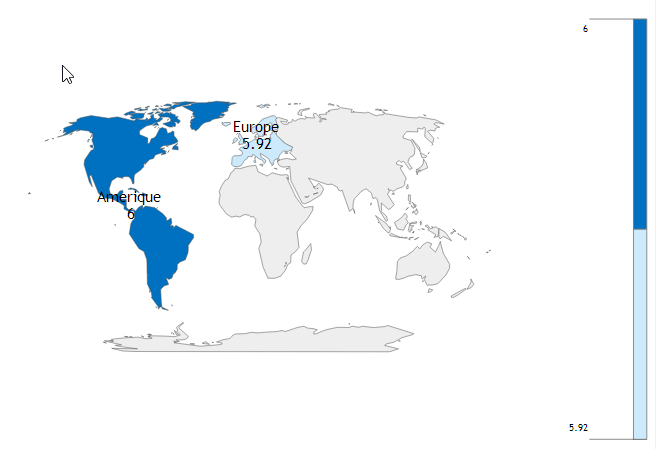
In this case, the data has been aggregated at a continental level. It means that we have placed the average of the American continent on the map, as well as the average of the European continent.
We also have the possibility to navigate through the various geographic hierarchies by clicking on the map. By clicking on Europe and then on France, we obtain a new map:
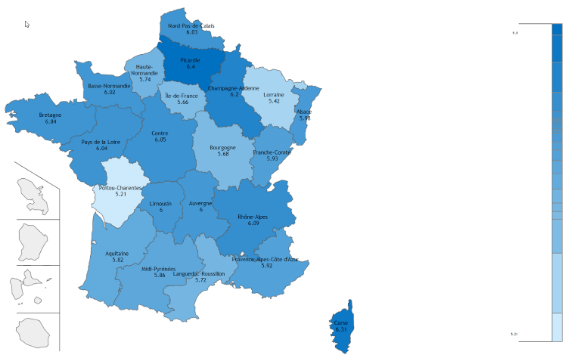
This time, the data has been aggregated at a regional level and not continental. The data visualization at a regional level is almost instantaneous. This is possible thanks to the data storing technology within the DigDash cubes. It also allows rapid navigation, even on a large amount of data, o the contrary of databases.
Definition n°10: What is aggregation?
Aggregation is the result of a value resulting from a calculation (sum, average, min, etc) to a measure explored by one or more dimensions. For example, the sum of revenue calculation of a store during a trimester is the result (aggregation) of the sum of a daily revenue data set during a trimester.
Definition n°11: What is a measure?
A measure is a digital indicator representing a quantity (for example, the turnover or the price of a product). This type of data, which is the basis of Business Intelligence, therefore has the specificity of being quantifiable. Omnipresent in graphic representations, measurements are however often associated with another type of data: dimensions.
Definition n°12: What is a dimension?
A dimension is a set of members (categories) that may or may not be organized according to one or more hierarchies. In other words, it is a filterable and searchable data, but not quantifiable, such as a date or a geographical area. A dimension can be discrete, which implies that its members do not have a particular order (for example the departments of France). It can also be continuous: in this case, the order of the members is important.
| How to differentiate a measure and a dimension?
It is possible to summarize the difference between measure and dimension in a simple sentence: you can add measures, but not dimensions. Let us take the example of a table containing two columns: “Customer name” and “Turnover”.
Another more subtle example: time is a measure, but the date is a dimension. Indeed, time is the difference between two dates and it can be quantified (in number of days, for example). |
Definition n°13: What is a hierarchy?
After having spoken of dimension, what could be more normal than to speak of hierarchy? It is a logical organization of the members of a dimension, in a hierarchical fashion.
For example, a geographical hierarchy whose highest level would be the continent, would contain the country level, then the region level and so on …
With DigDash Enterprise, it is possible to quickly create a manual hierarchy or an automatic hierarchy to better organize your data.
Now you have mastered all the essential concepts to fully understand Business Intelligence. From measurements to dimensions, including dashboards and data warehouses, each of these concepts will allow you to better exploit your data and thus make better decisions on a daily basis.