As the end of the year fast approaches, DigDash continues to move forward, developing new features designed to simplify the lives of its users.
On the agenda:
- A brand-new dashboard creation wizard which is simpler and more intuitive.
- The integration of Google Maps-style maps for graphic creation.
- The addition of a data catalog which helps companies batch metadata
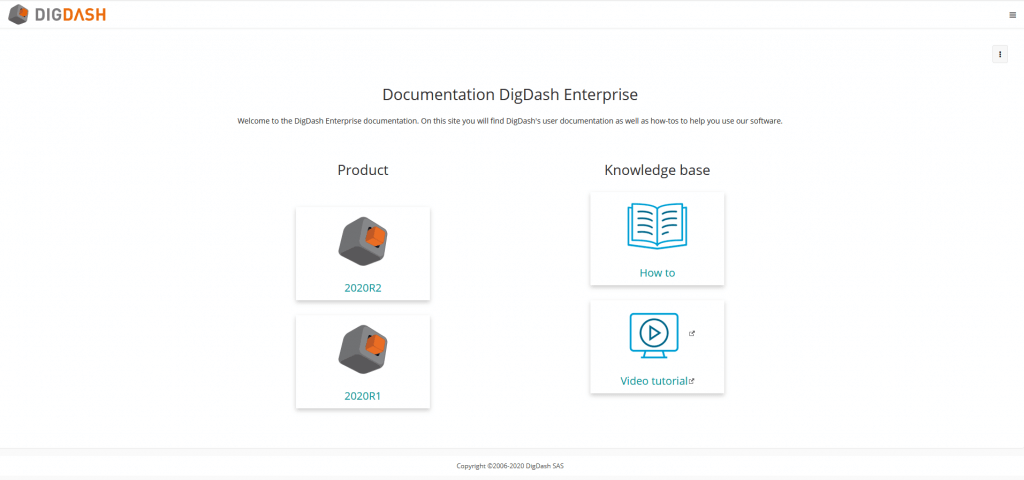
- The provision of online access to all our documentation, including guides (deployment guide, user manual, and configuration guide), troubleshooting, video tutorials, etc.
Modernized dashboards
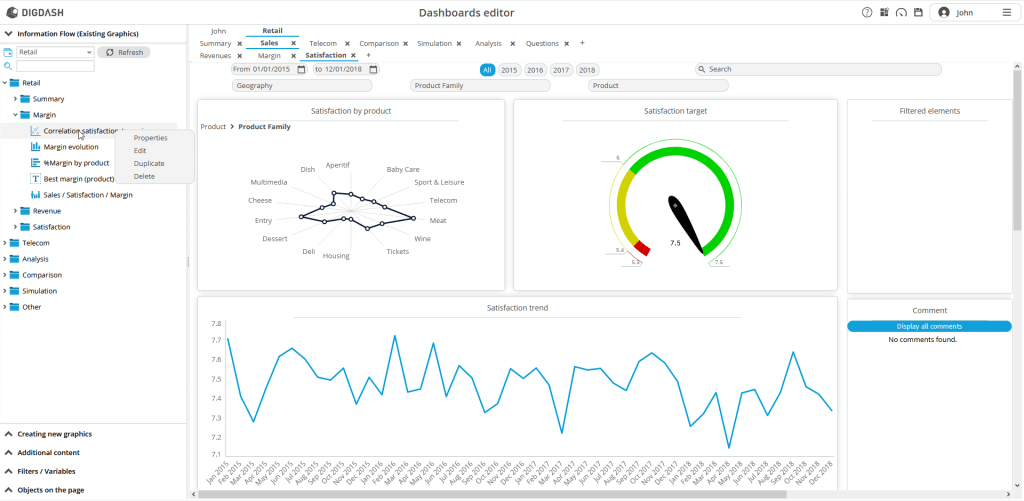
A brand-new look for the editor
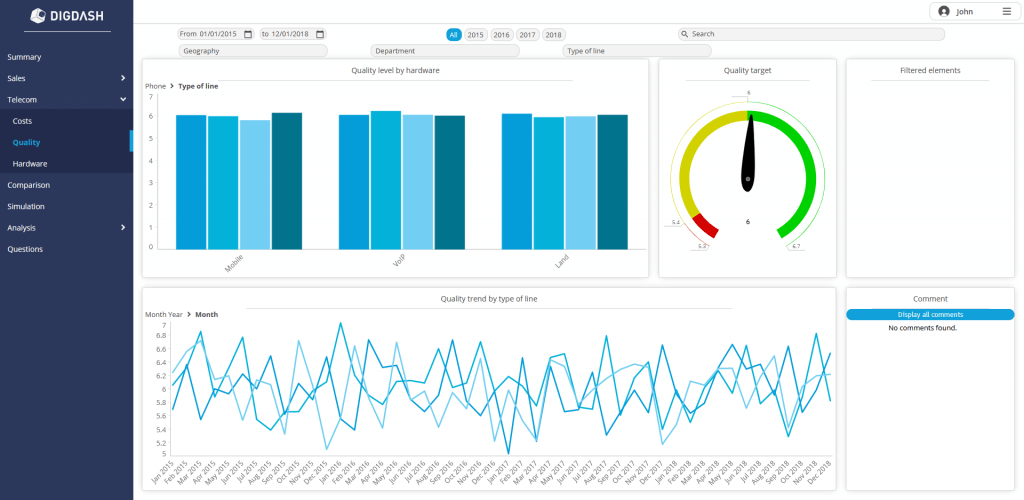
A makeover for the dashboard editor, giving it a more modern and airier feel. Icons, colors, spacing, and alignment — every detail has been reviewed and updated.
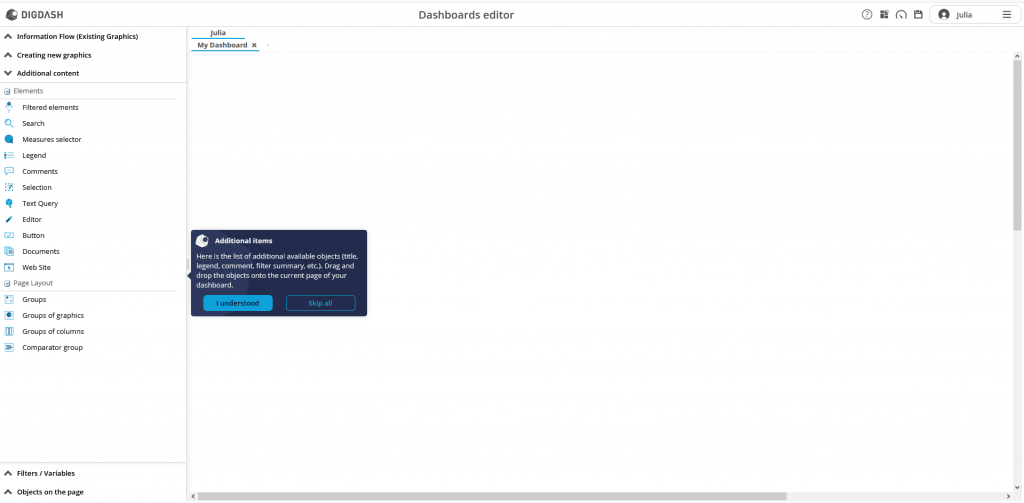
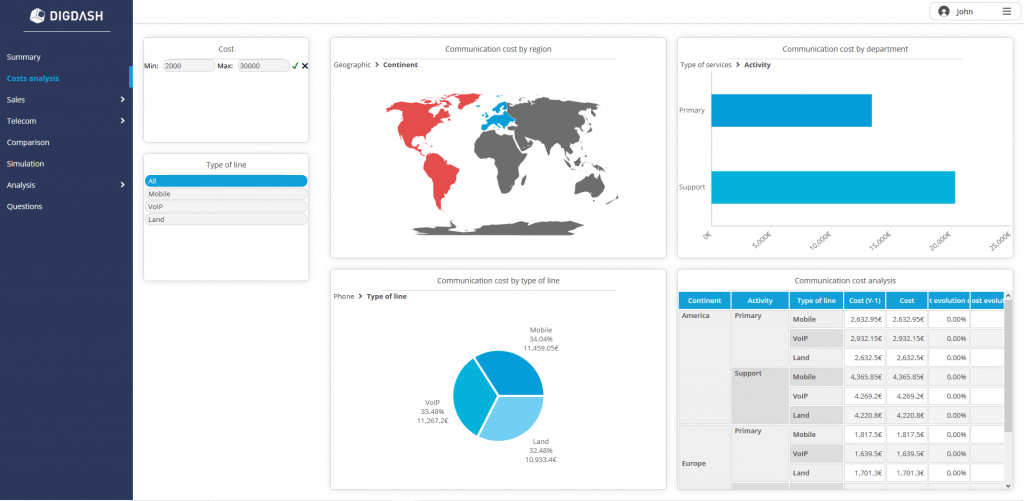
New vertical Menu
We’re revealing a new a vertical menu on the left side of the dashboard! The new menu allows you to navigate between the various dashboard pages. It’s also a useful space-saver when you have a lot of items displayed on the screen at once. It is even possible to remove the horizontal menus completely, for a different browsing experience.
Dashboard creation Wizard
A brand-new Dashboard Wizard builds on the old concepts of guided analysis, adding several new elements.
Starting with the addition of a new button in the top right corner of the dashboard which brings up the wizard and featuring a complete redesign of its interface. This interface is now a ‘Wizard’ that guides the user in a simple and intuitive way through the various steps:
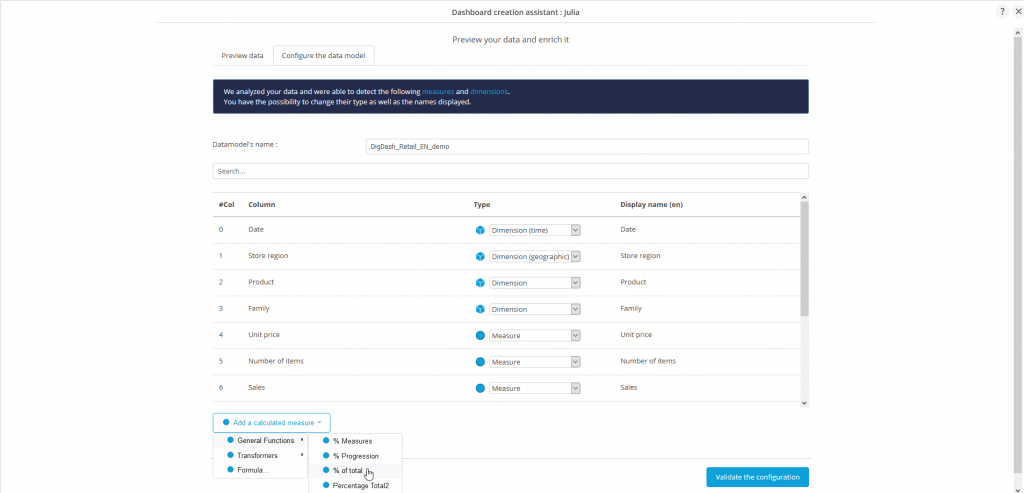
1- Upload a file or a demo source
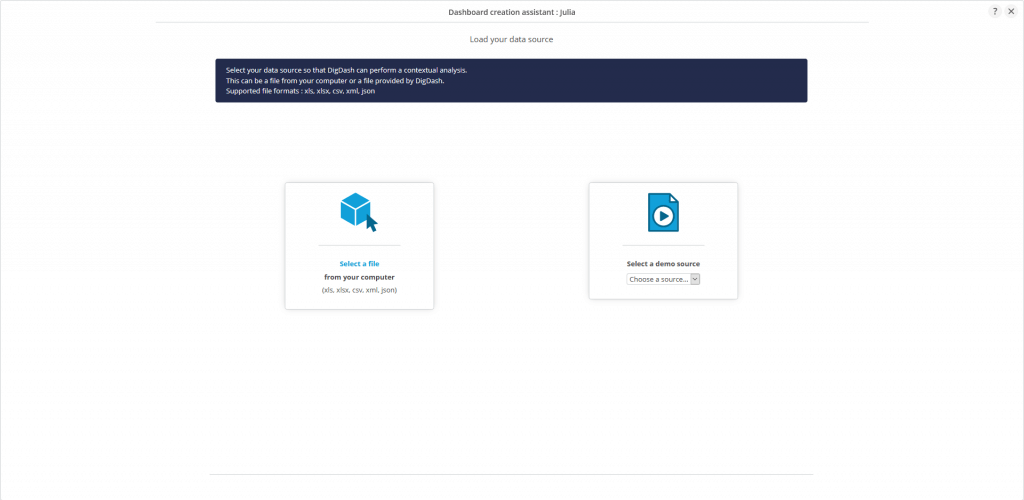
2- Configure the model by adding calculated measurements, for example.
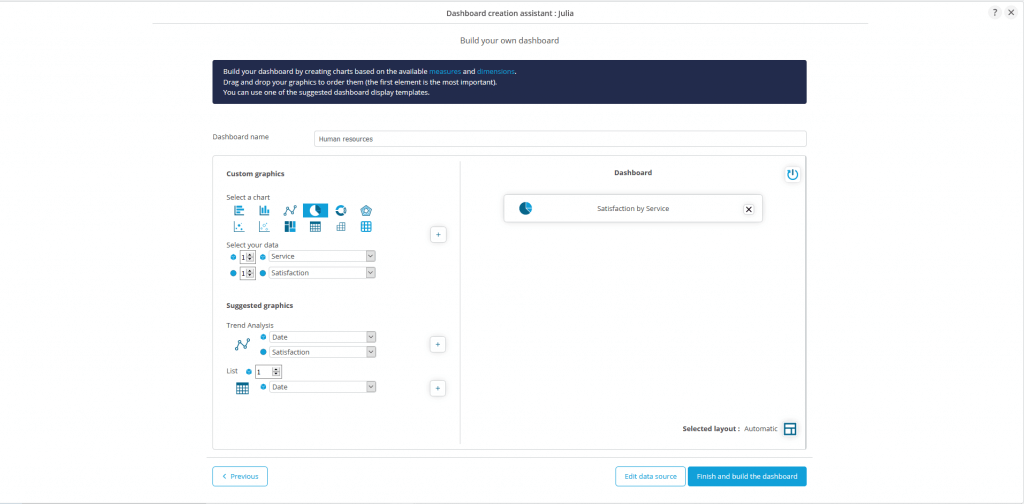
3- Automatically generate a dashboard with pre-built graphics or choose to customize it.
Actions on dashboard objects
New options for manipulating graphs are available from the dashboard editor, including edit, copy, cut, and category change. All this is now possible without going through the studio.
Filters on measures
These filters are also evolving: they can now be added directly from the dashboard. Simply enter the minimum and maximum values of the measures and the dashboard graphs are automatically filtered.
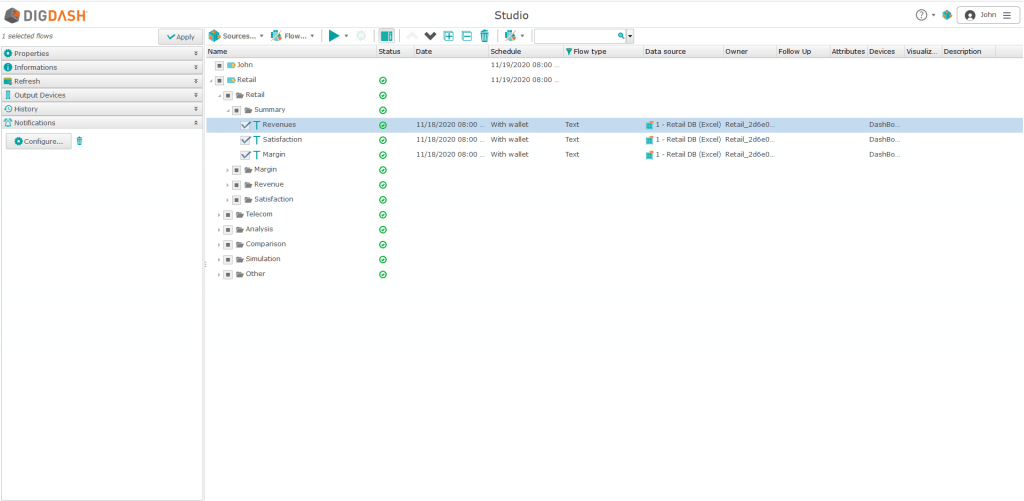
A more powerful and fully online studio
Redesign of the web studio
Some time after its transition to full web mode, the DigDash Enterprise studio is now undergoing a makeover of its menus. Objective: To offer standardized interfaces that allow for seamless movement between tools. The studio, configuration pages and dashboards are now 100% standardized.
Creation of PPT/PDF documents
A new wizard integrated into the web studio facilitates the generation of PPTs/PDFs before document exportation. Formerly available in the desktop studio, this wizard is now accessible from web studio.
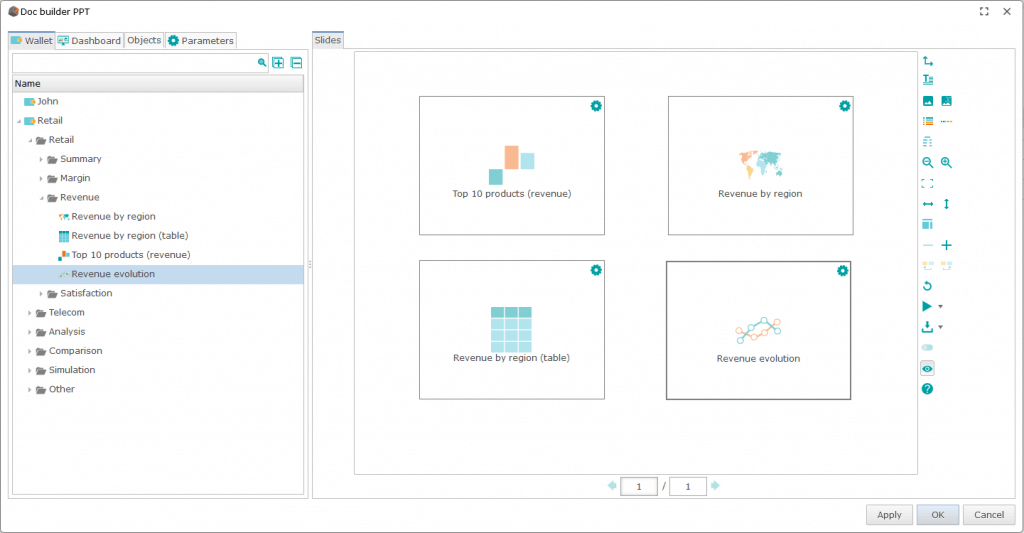
Customizable images (in PNG, SVG or JPG format) can also be added in document production. This allows you to display images directly, instead of members of the dimension.
DigDash Metadata Service
Latest studio updates: The addition of “DigDash Metadata Service”, which allows for downloading a set of metadata provided by DigDash. JavaScript functions, styles, and maps. Components that will enrich the existing default data catalogs of DigDash Enterprise.
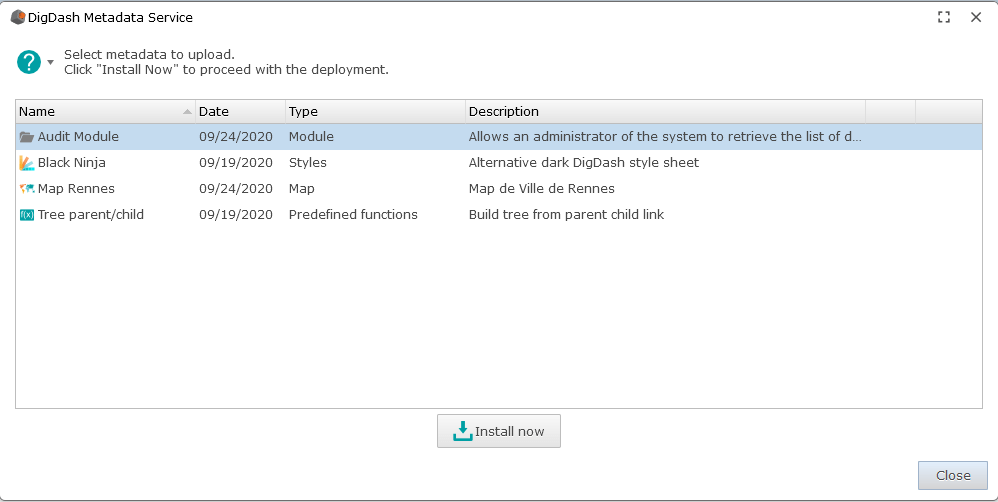
A new and easy-to-use functionality, featuring fully-automated installation.
New options for customizing graphics
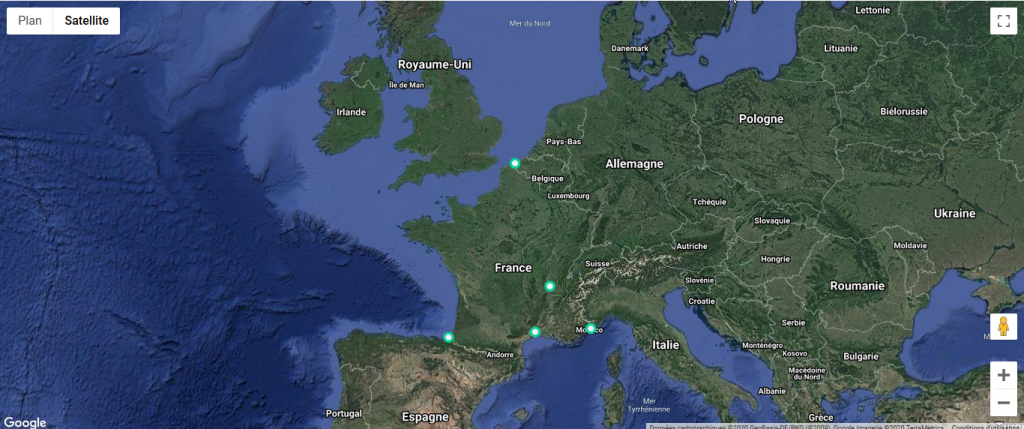
Google Maps-style maps
The latest version of DigDash is marked by the appearance of a new, eagerly awaited map style: Google Maps. Note that the data used will remain OpenStreetMap data.
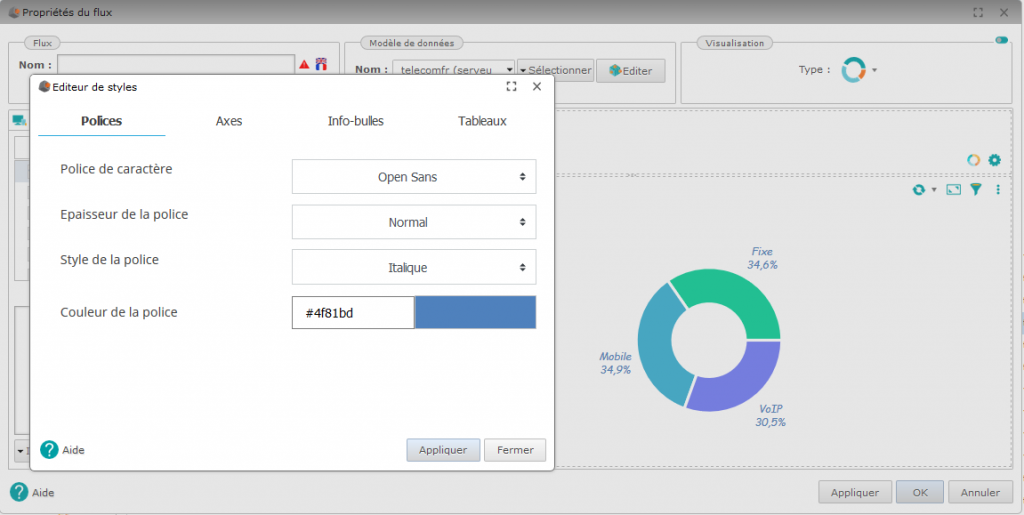
Style Editor
From fonts to colors to borders, everything is customizable with our brand new, highly intuitive interface. Accessible to all, the CSS style sheet is automatically generated with data selected from a large panel.
Enhanced HTML Reports
HTML report graphs have also been improved. There’s no longer a need to create the structure of the HTML code by yourself: DigDash now offers a default template that you can automatically generate and modify at your convenience.
An increasingly rich data model
Last but not least, the integration of a data catalog of the metadata stored by the company. This allows the structure, quality, documentation and use of each piece of data to be accessed easily from a centralized location. Based on dependency analysis, this catalog provides not only a description of the data, but also tells you who is using the data and what it is related to.
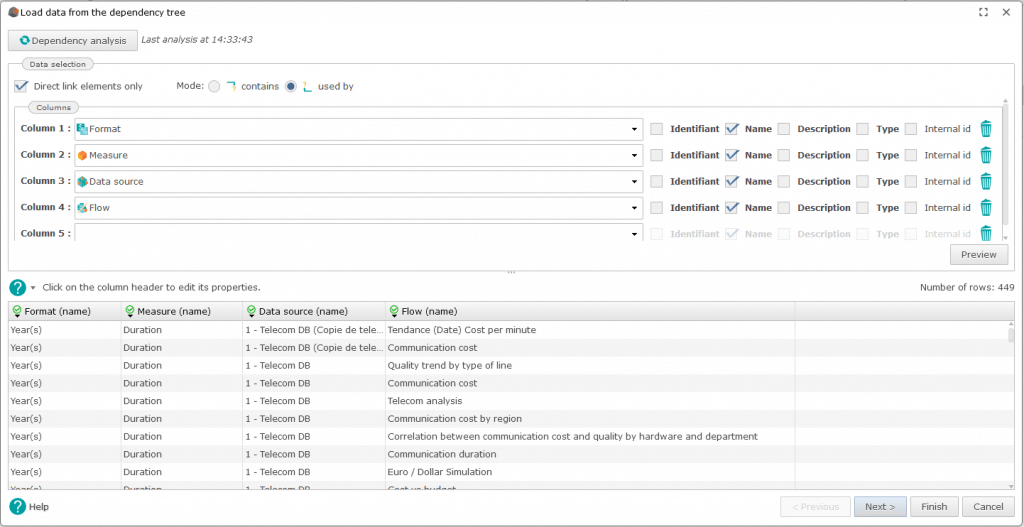
This is a real asset for data governance, ensuring that data is distributed to the right people, at the right time, and at the expected quality. This is made possible by a true mapping the lifecycle of the data, which provides the source of the data as well as any transformations it has undergone.
DigDash is always listening to its users, and we are constantly evolving in order to best meet your needs. From intuitive interfaces to advanced customization options, this new version focuses on ease of use, while offering powerful features that help you make the most of your data.