Easy access to reliable and up-to-date data for effective communication and decision-making are major challenges, and it has been highlighted now more than ever by the context of this current crisis.
We have therefore decided to use our expertise in data analysis and visualization to aid in the fight against the coronavirus
An open-access dashboard based on Open Data Public Health sources
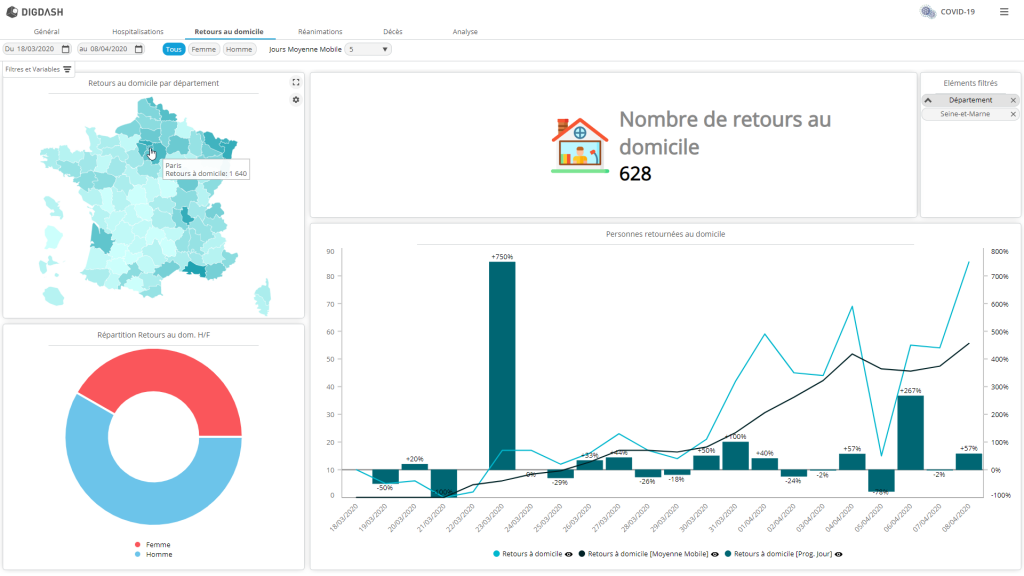
In order for everyone to be able to freely access the official COVID-19 statistics in France and throughout the world on a daily basis, we have created an analytical dashboard based on Open Data sources.
For France, this includes various data such as the number of hospitalizations, intensive care admissions, deaths, discharges, etc. They are classified by day, week, department, gender, etc. A ‘Self-Service BI’ tab is available to create your own analysis table.
This data comes from Santé Publique France. (the French Public Health Agency).
On the other hand, the global data comes from sources from the John Hopkins University. The tool identifies confirmed cases, recovered cases and deaths for a target group of 6 countries or for the whole world. Thus, it is possible to analyze date by date of containment and per million inhabitants.
Daily hospital data in Spain are also collected by autonomous community and the data come from the Spanish ministry of health.
Access the dashboard on http://covid.digdash.com
A solidarity offer to make our solution available to those involved in the fight
We are also offering, as part of Open Solidarity and our partnership with OVHcloud, our agile dashboard solution for free to companies and organizations involved in the fight against Coronavirus.
This offer includes:
- making the DigDash Enterprise platform available for free in hosted mode on OVHcloud
- complete assistance for dashboard configuration for free.
Although initially proposed to health professionals, we have since extended our offer to various companies, which, due to their sector of activity, need to communicate efficiently by means of dynamic content in the form of dashboards.
Among the needs that have become paramount during this crisis, the following have been particularly highlighted:
- Monitoring stocks of medical or similar devices;
- Monitoring data, thus allowing better and faster decision-making in the sectors involved;
- Implementing a better unified communication between services/departments due to the confinement;
- Implementing a multidimensional analysis for companies directly impacted by this crisis;
- Making the platform available to companies or associations managing the most disadvantaged;
- Monitoring multi-source data
…..
If you are also involved in the fight against COVID and wish to check our platform for free, send us a request via the dedicated form.
Our management committee will assess your project as soon as possible.