Strategic management is an essential condition for good governance. Never hesitate to go back on a bad decision and change course! Knowing how to bounce back in time and adapt your marketing approach according to the context are the intrinsic qualities of a good leader, a department or service manager.
You can also refer to our article: how to ensure the good health of my company
To help you, there is a valuable tool, the management dashboard or tracking chart now available in the form of bi software, an indispensable tool for an effective Business Intelligence.

What is a business dashboard and what is it for?
The Business Dashboard is a document that groups together a number of businesses, economic, financial, or HR metrics of a company. The true lever of company performance, it gives an inventory of a company, a service, a project … at a precise moment. This data representation tool is a management and steering accessory that is useful for all companies, even the smallest of them. It analyzes the past to help you better plan for the future!
If it can adapt to all activities of the company, this dashboard tool is widely used in a commercial department to manage and track the activities of sales representatives as the launch of a product or the management of a business car fleet.
For example, do you want to have powerful KPIs to measure progress or to achieve a strategic goal? Your management dashboard will group these performance indicators, which you will need to keep up to date. An analysis of your KPIs will be a valuable aid to any decision making.
How to make your dashboard effective: the essential rules
To be effective your dashboard must give a clear and synthetic vision of the analyzed activity. At first glance, one must have an understandable overview of the situation.
Your tracking chart should:
– identify the right indicators: Gathering reliable and relevant information is an essential rule. We discuss this in more detail in this article: how Comment introduire la BI dans votre entreprise ?
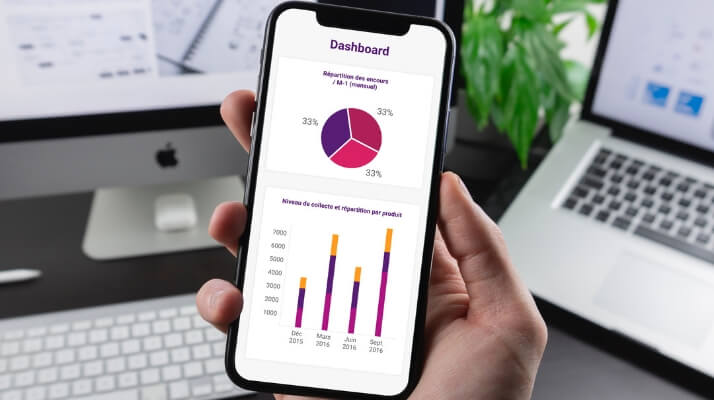
– be perfectly readable at first glance: you can use all possible formatting (graphics, histograms, curves, pie charts …) which will allow you to be alerted when the situation becomes critical. The sudden drop of an indicator will alert you while there is still time on what’s wrong.
10 mistakes to prevent when creating à dashboard
Dashboard software, a key tool for business intelligence
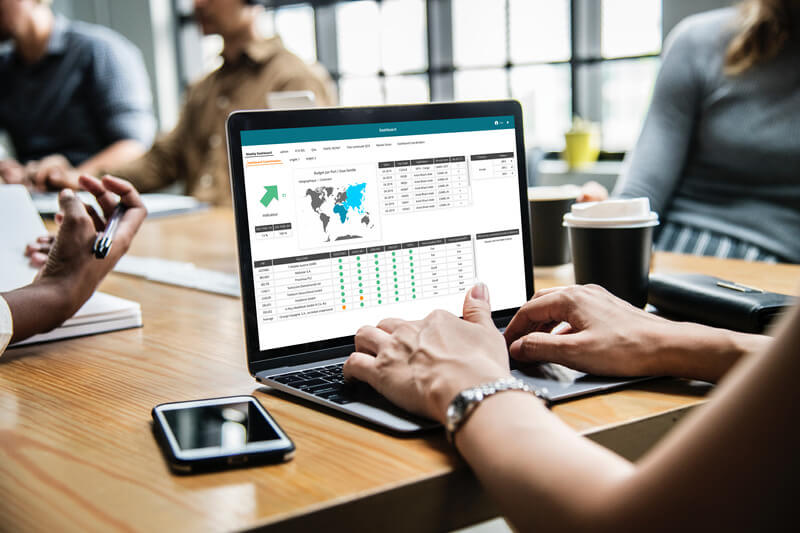
Beyond the simple Excel document, often not very legible, there is a multitude of answers in the form of quality tools adapted for each marketing need, HR etc … The solutions of reporting tools have diversified on the market since these last years. To choose your dashboard tool, start by asking yourself the right question: What are my needs in this area?
From there your choice will be directed to:
Flexible, scalable software
It must be able to recognize the format of the data to be exploited, to adapt to other software and applications already used within your company. For example, you can privilege a solution connected to the accounting software.
A simple software
Your dashboard software must be able to be used by inexperienced employees who can provide all kinds of data in various forms (tables, curves, graphs …) that are clear and easy to interpret.
Personalized dashboard software: a management tool adapted to your needs
Do not drive your company at sight anymore, at the risk of going nowhere! To optimize their internet organization, many executives choose to invest in dashboard software. However, there are many solutions on the market; which does not always facilitate the selection of the solution that will help you improve the productivity of your marketing or communication department for example.
It is strongly recommended to invest in a real BI software (Business Intelligence) offering a management dashboard or even better, in a custom dashboard software that will take into account your specific needs. The rate of return, cash flow, customer and supplier settlement time, turnover, the study of competition, energy consumption … are examples of dashboards that can be useful. Other dashboards integrating surveys, qualitative surveys, sign analyzes, volume indicators … will help you to segment an activity, to define quantifiable criteria and measurable communication objectives. Dashboard examples are not lacking!
DigDash is the expert of business intelligence and puts its skills at your service with its dynamic dashboard, able to render your data clearly and simply.